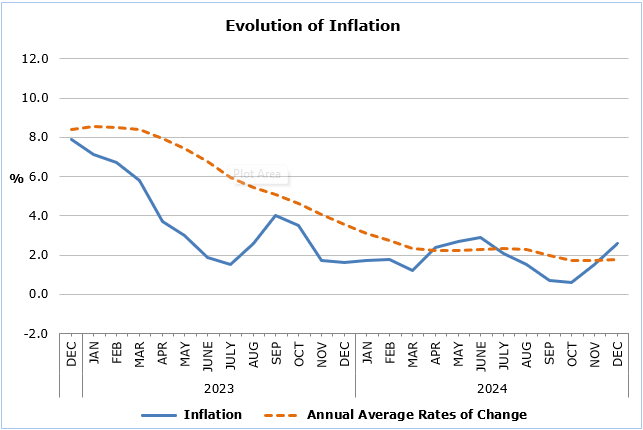
For the period January – December 2024, the Consumer Price Index (CPI) recorded an increase of 1,8% compared to the corresponding period of the previous year. (Table 1)

The largest change in economic categories compared to December 2023 and the previous month was recorded in Agricultural Goods, with percentages of 16,8% and 2,6%, respectively. (Table 2)
Analysis of Percentage Changes
Compared to December 2023, the largest changes were observed in the categories of Food and Non-Alcoholic Beverages (7,6%) and Restaurants and Hotels (4,4%). (Table 1)
In comparison to November 2024, the largest change was recorded in the category of Food and Non-Alcoholic Beverages (0,7%). (Table 1)
For the period January – December 2024, compared to the corresponding period of the previous year, the largest change was observed in the category of Restaurants and Hotels (5,4%). (Table 1)
Analysis of Effects in Units
The categories Food and Non-Alcoholic Beverages (1,69) and Restaurants and Hotels (0,45) had the most significant positive impact on the change in the Consumer Price Index (CPI) for December 2024 compared to December 2023. (Table 3)
The category Clothing and Footwear (-0,21) had the most significant negative impact on the CPI change for December 2024 compared to December 2023. (Table 3)
The category Food and Non-Alcoholic Beverages (0,16) had the greatest impact on the CPI change compared to the previous month. (Table 3)
The categories Fresh Vegetables (0,90), Catering Services (0,45), and Meat (0,23) had the largest impact on the CPI change for December 2024 compared to the December 2023 index. (Table 4)
Fresh Vegetables had the most significant positive impact on the CPI change for December 2024 compared to the previous month’s index (0,58), while Potatoes (-0,17) had the most significant negative impact. (Table 5)
| Table 1 | |||||
| Categories of Goods and Services |
CPI (2015=100) | Change (%) | |||
| November 2024 |
December 2024 |
Dec 24/
Dec 23 |
Dec 24/ Nov 24 | Jan- Dec 24/
Jan- Dec 23 |
|
| Food and Non-Alcoholic
Beverages |
124,96 | 125,79 | 7,58 | 0,66 | 3,34 |
| Alcoholic Beverages and Tobacco | 103,78 | 103,37 | 2,20 | -0,40 | 2,05 |
| Clothing and Footwear | 107,09 | 107,13 | -2,64 | 0,04 | -0,28 |
| Housing, Water, Electricity, Gas and Other Fuels | 146,08 | 146,40 | 1,45 | 0,22 | 1,19 |
| Furnishings, Household Equipment and Routine Maintenance of the House | 105,20 | 104,60 | -0,23 | -0,57 | -0,45 |
| Health | 106,96 | 107,03 | 1,36 | 0,07 | 1,24 |
| Transport | 114,08 | 113,85 | 0,98 | -0,20 | -0,50 |
| Communication | 91,55 | 91,53 | 0,21 | -0,02 | 0,53 |
| Recreation and Culture | 116,60 | 116,45 | 2,86 | -0,13 | 2,23 |
| Education | 116,18 | 116,18 | 3,82 | 0,00 | 2,81 |
| Restaurants and Hotels | 129,76 | 129,98 | 4,37 | 0,17 | 5,43 |
| Miscellaneous Goods
and Services |
111,94 | 111,69 | 1,83 | -0,22 | 2,91 |
| General Consumer Price Index | 118,21 | 118,31 | 2,62 | 0,08 | 1,81 |
| Table 2 | |||
| Economic Origin | Weights | Change (%) | |
| Dec 24/ Dec 23 | Dec 24/ Nov 24 | ||
| Agricultural goods | 749 | 16,77 | 2,58 |
| Industrial goods (excl. petroleum products) | 4021 | 0,34 | -0,46 |
| Electricity | 316 | -0,66 | 0,50 |
| Petroleum products | 871 | 0,42 | 0,26 |
| Water | 72 | 0,00 | 0,00 |
| Services | 3971 | 3,07 | -0,02 |
| General Index | 10000 | 2,62 | 0,08 |
| Table 3 | |||
| Categories of Goods and Services | Weights | Effect (units) | |
| Dec 24/ Dec 23 | Dec 24/ Nov 24 | ||
| Food and non-Alcoholic Beverages | 1906 | 1,69 | 0,16 |
| Alcoholic Beverages, Tobacco | 347 | 0,08 | -0,01 |
| Clothing and Footwear | 721 | -0,21 | 0,00 |
| Housing, Water, Electricity, Gas and Other Fuels | 1119 | 0,23 | 0,04 |
| Furnishings, Household Equipment and Routine Maintenance of the House | 644 | -0,02 | -0,04 |
| Health | 637 | 0,09 | 0,00 |
| Transport | 1524 | 0,17 | -0,04 |
| Communication | 439 | 0,01 | 0,00 |
| Recreation and Culture | 575 | 0,19 | -0,01 |
| Education | 392 | 0,17 | 0,00 |
| Restaurants and Hotels | 836 | 0,45 | 0,02 |
| Miscellaneous Goods and Services | 860 | 0,17 | -0,02 |
| General Consumer Price Index | 10000 | 3,02 | 0,10 |
| Note: Totals are calculated on the basis of the effects of the categories with infinite decimal figures and rounded up to two decimals when published. Figures may not add to totals due to rounding error. |
|||
| Table 4 | |
| Goods/Services | Effect (units) |
| Dec 24/ Dec 23 | |
| Positive effect | |
| Fresh Vegetables | 0,90 |
| Catering Services | 0,45 |
| Meat | 0,23 |
| Potatoes | 0,18 |
| Services for Regular Maintenance of Dwellings | 0,15 |
| Various Other Goods and Services | 1,25 |
| Negative effect | |
| Clothing Items | -0,10 |
| Electricity | -0,04 |
| TOTAL | 3,02 |
| Table 5 | |
| Goods/Services | Effect (units) |
| Dec 24/ Nov 24 | |
| Positive effect | |
| Fresh Vegetables | 0,58 |
| Electricity | 0,03 |
| Petroleum Products | 0,03 |
| Catering Services | 0,02 |
| Negative effect | |
| Potatoes | -0,17 |
| Fresh Fruits | -0,10 |
| Airfares | -0,05 |
| Various Other Goods and Services | -0,24 |
| TOTAL | 0,10 |
#Consumer #Price #Index #CPI #December #increased #points #Famagusta #Gazette


Leave a Reply