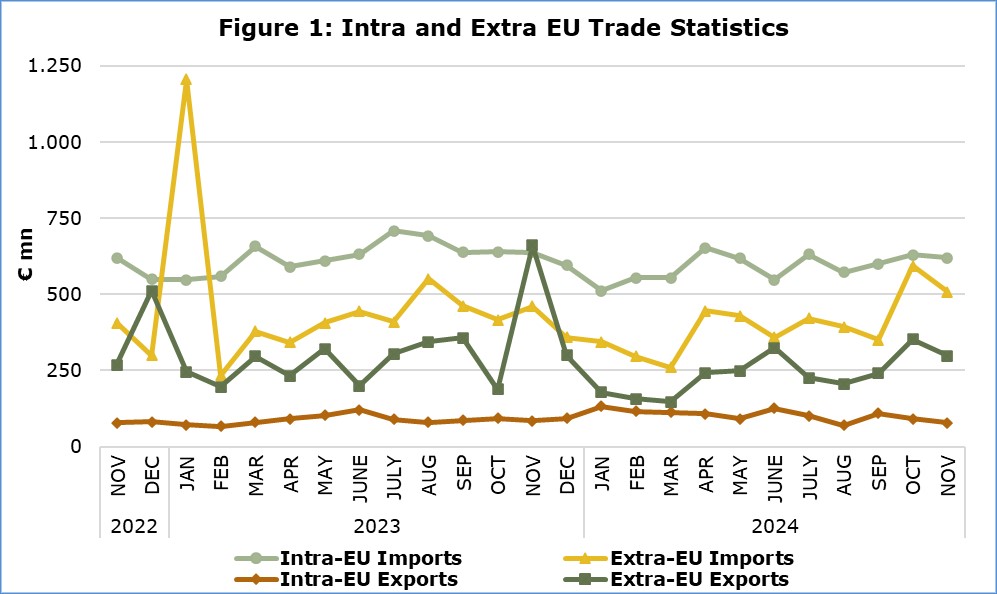
Total imports of goods in November 2024 were €1.128,7 mn as compared to €1.098,6 mn in November 2023, recording an increase of 2,7%. Imports from other EU Member States were €620,2 mn and from third countries €508,5 mn, compared to €638,1 mn and €460,5 mn respectively in November 2023. Imports in November 2024 include the transfer of economic ownership of vessels, with total value of €138,8 mn as compared to €124,2 mn in November 2023.
Total exports of goods in November 2024 were €376,5 mn as compared to €745,8 mn in November 2023, recording a decrease of 49,5%. Exports to other EU Member States were €77,7 mn and to third countries €298,8 mn, compared to €84,7 mn and €661,1 mn respectively in November 2023. Exports in November 2024 include the transfer of economic ownership of vessels, with total value of €54,2 mn as compared to €417,3 mn in November 2023.
Total imports of goods in January–November 2024 amounted to €10.900,7 mn as compared to €12.225,6 mn in January–November 2023, recording a decrease of 10,8%. Total exports of goods in January-November 2024 were €3.761,1 mn compared to €4.317,0 mn in January-November 2023, registering a decrease of 12,9%. The trade deficit was €7.139,6 mn in January–November 2024 compared to €7.908,7 mn in the corresponding period of 2023.

October 2024, Final Data
Total imports of goods amounted to €1.223,8 mn in October 2024 as compared to €1.057,0 mn in October 2023, recording an increase of 15,8%.
Exports of domestically produced products, including stores and provisions, in October 2024 were €295,7 mn as compared to €165,7 mn in October 2023, recording an increase of 78,5%. Domestic exports of industrial products in October 2024 were €288,5 mn compared to €160,0 mn in October 2023, whilst domestic exports of agricultural products in October 2024 were €5,9 mn compared to €4,2 mn in October 2023.
Exports of foreign products, including stores and provisions, in October 2024 were €147,3 mn as compared to €116,1 mn in October 2023, recording an increase of 26,9%.

More data are published in the monthly publication ‘Intra – Extra EU Trade Statistics (Summarised Data) – October 2024’ and in the online database CYSTAT-DB, under the subtheme External Trade.
| Table | ||
|
Year and Month |
Total Imports |
Total Exports |
|
€000’s |
€000’s |
|
| 2024 |
|
|
| November | 1.128.716 | 376.486 |
| October | 1.223.783 | 442.950 |
| September | 951.889 | 350.508 |
| August | 966.550 | 276.716 |
| July | 1.052.834 | 327.116 |
| June | 905.628 | 450.447 |
| May | 1.047.982 | 340.793 |
| April | 1.098.529 | 350.750 |
| March | 816.066 | 261.009 |
| February | 852.143 | 273.236 |
| January | 856.554 | 311.088 |
| 2023 |
|
|
| January – December | 13.179.758 | 4.709.389 |
| December | 954.146 | 392.429 |
| November | 1.098.573 | 745.785 |
| October | 1.056.959 | 281.770 |
| September |
1.101.388 |
444.197 |
| August | 1.243.104 | 422.799 |
| July | 1.117.523 | 395.606 |
| June | 1.076.567 | 321.856 |
| May | 1.015.991 | 423.444 |
| April | 932.823 | 324.630 |
| March | 1.035.073 | 376.672 |
| February | 794.000 | 262.520 |
| January | 1.753.611 | 317.682 |
| Note: Imports and exports data for September and October 2024 have been revised. Data for November 2024 are provisional. | ||
#Cyprus #Foreign #Trade #Statistics #October #November


Leave a Reply